Drive Data-Driven Decisions with Tableau: A Comprehensive Guide
In today’s world, data is a crucial component helping businesses and organizations make informed decisions. Instead of making decisions based on intuition or guesswork, data-driven decisions are more efficient, accurate, and effective. Tableau is one tool that enables organizations to conduct data visualization, analysis, and sharing. This guide dives deep into Tableau, providing steps on how to drive data-driven decisions through the tool.
Understanding Tableau
Tableau is a data visualization tool that allows organizations to connect to various types of data stored in different formats. It provides a platform for data analysis, exploration, and presentation. Tableau’s key strengths lie in its ability to connect to data from multiple sources, create interactive visualizations, and enable collaboration within organizations. It offers a user-friendly interface that allows users to create rich and detailed reports quickly. As such, Tableau makes it easier for organizations to consume and understand data.
Driving Data-Driven Decisions with Tableau
1. Connect Data from Various Sources
Tableau can connect to a wide range of data sources, including cloud-based data sources, spreadsheets, databases, and business intelligence systems. Connecting to data sources allows organizations to analyze data from multiple sources and gain a deeper understanding of their operations. For instance, connecting to sales data from different geographical locations can enable a company to have a more accurate view of its sales trends.
2. Create Interactive Visualizations
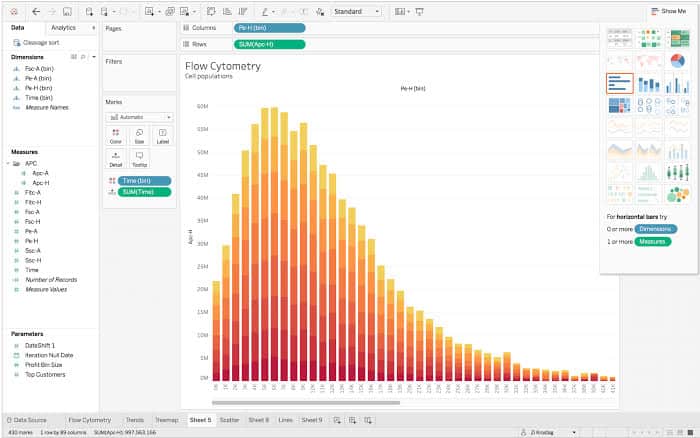
Tableau allows users to create interactive visualizations that are easy to interpret. These visualizations offer a simple way for stakeholders to understand the underlying data and make informed decisions based on the data. Visualizations could take the form of charts, graphs, or dashboards, and can be customized to meet specific requirements.
3. Utilize Analytics and Dashboards
Tableau offers several analytics and dashboards features that allow organizations to gain real-time insights into their operations. Dashboards enable companies to monitor critical metrics and identify trends quickly, while analytics provide a platform for predictive analytics, trend analysis, and statistical analysis.
4. Foster Collaboration
Tableau allows for seamless collaboration between different departments within an organization. Users can share data, insights, and dashboards with others in the business, enabling everyone to make data-driven decisions. Collaboration strengthens decision-making by ensuring that everyone can access the same data and insights.
5. Enable Mobile Reporting
Tableau has a mobile app that allows users to access and analyze data on their mobile devices. The mobile app supports iOS and Android devices, making it easier for decision-makers to access critical data on-the-go. The mobile app also supports offline access to dashboards, ensuring that users can access their data even when not connected to the internet.
Common Mistakes to Avoid When Using Tableau
While Tableau is an excellent tool for making data-driven decisions, there are several mistakes that organizations and users should avoid when using the tool. These include:
1. Not Setting Clear Objectives
Before starting a data analysis project with Tableau, it is essential to define clear objectives. Setting objectives enables companies to determine the right data sources, the visualization requirements, and the reporting needs. Failure to set clear objectives could lead to gathering irrelevant data, creating inadequate reports or visualizations, and drawing incorrect conclusions.
2. Overcomplicating Visualizations
While Tableau has an extensive range of visualization tools, it is essential to avoid creating overly complicated visualizations. Complex visualizations may lead to confusion, misinterpretation, and incorrect conclusions. Instead, businesses should focus on creating simple, easy-to-understand visualizations that convey the necessary insights to stakeholders.
3. Ignoring Security
When working with Tableau, organizations must take data privacy and security concerns into consideration. Failing to secure data can lead to data breaches or unauthorized access to confidential data. To avoid such incidents, businesses should take the necessary security measures when sharing data, creating reports, and visualizations.
FAQs
1. What is Tableau?
Tableau is a data visualization tool that enables organizations to connect to multiple data sources, conduct data analysis, and present data through interactive visualizations. Tableau provides a platform for data exploration and collaboration within organizations.
2. What are the key benefits of using Tableau?
Tableau offers several benefits to organizations, including the ability to connect to multiple data sources, create interactive visualizations, utilize analytics and dashboards, foster collaboration, and enable mobile reporting. Tableau makes it more comfortable for organizations to understand and make decisions based on data.
3. What mistakes should businesses and users avoid when using Tableau?
Businesses and users should avoid several mistakes when using Tableau, including not setting clear objectives, overcomplicating visualizations, and ignoring data privacy and security concerns. By avoiding these mistakes, businesses and users can effectively utilize Tableau to drive data-driven decisions.

