For those of you who want to dive into the world of programming or developing, like it or not, you have to be familiar with debugging. Debugging is the process of removing bugs in the code.
Oh, spoiler, yes, the bug in coding is really annoying. If there is even one bug in the code, the whole program can crash, it can even jeopardize the security of a program that has been painstakingly created.
But calm down, getting rid of bugs is not as difficult as imagined, really. In this article, we will discuss what debugging is, how it works, and learn how to handle debugging with 9 effective tips.
What is Debugging?

Debugging is the process of identifying and removing bugs or errors in the code.
This bug causes an application or software not to run properly. For example, failed logins, errors when inputting data, feature dysfunctions, blue screens, etc.
Since the coding system of a program is usually complex and complex, a single error in the code can affect the entire program.
It’s no wonder that debugging can take longer than writing the program itself.
That’s why debugging is so important. Both before the release of the application and after.
You don’t want it, right, the program is already running, let alone used by the client, but suddenly there is an unexpected error? Or even abused intruders such as malware and his comrades? Hey, that’s scary!
Why is Debugging Needed?
Debugging is one of the mandatory things when building a code-based application/software.
In addition to the main goal of solving bugs, this process has several other benefits , such as:
- Errors can be detected early;
- The repair process can be carried out as early as possible;
- Avoid further program design errors;
- Can provide data structure information;
- Help developers reduce useless information;
- Reducing the risk of hackers infiltrating through bugs or errors;
- Developers can avoid complicated testing processes, saving time and energy when coding.
How Debugging Works

Usually, debugging will be done by the debuggers . However, this skill is also an important point that programmers or full stack developers must have.
That’s because the way debugging works is very close to coding work. Sequentially, how debugging works can be described in six steps, namely:
1. Reproducing Bugs
The first thing you should do is reproduce the bug. The trick is to properly document all existing bug issues .
There are several objectives why this stage is very important, namely:
- Determine the priority scale for resolving bugs;
- Bugs can be solved with the right team;
- Map out which bugs have not been resolved, are ready for testing, and passed quality control;
- Test on different devices and browsers to see if there are any other bugs.
When you’ve reproduced a bug it means you’ve pocketed any bugs that need to be fixed. Well, you can appoint the relevant teams to do the next stage.
2. Identifying Errors
Next, identify errors, namely by collecting error reports or errors in the program. For example, when a software command fails to execute, there may be a syntax bug in the script.
This list of errors is usually obtained when testing the program, both internal testing and testing by clients.
At this stage, make sure to really identify the program thoroughly. So that the debugging process is more efficient and later there will be no more bugs that are still left.
3. Locating the Bug
After identifying, it’s time to find out where the error in the code is. For example, in navigation code, command buttons, etc.
That’s why identification of bugs during testing is important. Because the location of the bug may be detected at that time.
4. Analyze Errors
Okay, already know there is a bug and where it is located, so let’s analyze the error, so that later the right fix can be done.
Tips for sure : Use bottom-up techniques or analysis from the smallest code at the error location to the surrounding code unity.
The goal is to keep you aware of other bugs surrounding the error code. And minimize the risk of additional errors during repair.
Like a radar, you can fix the error center as well as find other errors. Who knows, the error code will have an effect on other codes, right?
5. Proving Error Analysis
Well, the results of your bug analysis may find bugs in certain locations. Before fixing it, you need to prove that there are no other errors that might appear in the software.
To do this, you can write automated tests on bug locations with the help of the test framework.
After the test script is done and there are no problems / errors that may appear, then go to the next stage.
6. Perform Debugging on All Errors
If you find more than one bug, don’t be sad. You can collect in advance all the unit test code that you want to change.
Once everything is gathered, run a code test on each code you want to change. Remember, everything must pass the trial, yes.
7. Fix and Validate Scripts
OK, you’ve come to the final step.
Already have a fix code? Well, this is the moment you’ve been waiting for, put all the code that you have fixed and has passed the test into the framework.
Always do double checking . Retest all scripts and make sure the program runs as expected.
If there are any more bugs? Do not hesitate to repeat from number one yes. Spirit!
Debugging Tips for Beginners
In addition to these six must-dos, there are some debugging tips that you should know.
The following tips can make debugging a very complicated and tedious process easier. Both in CMS WordPress and coding such as HTML, PHP, etc.
What are the tips? Read on for more.
1. Enable WP_DEBUG
WP_DEBUG is a debugging mode feature in WordPress. The system works by “forcing” WordPress to display error messages and provide warnings for bugs encountered.
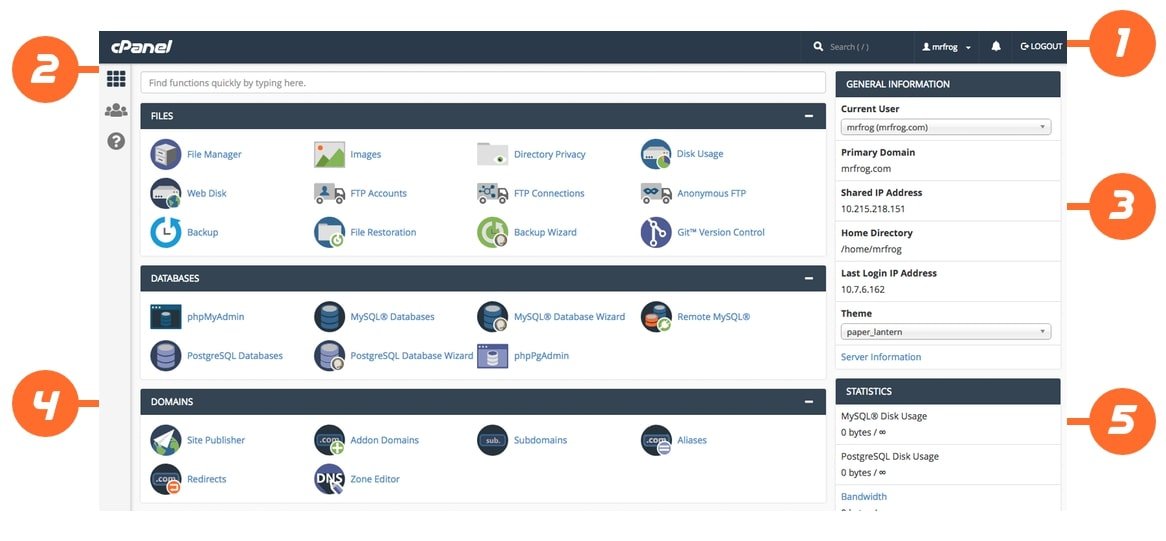
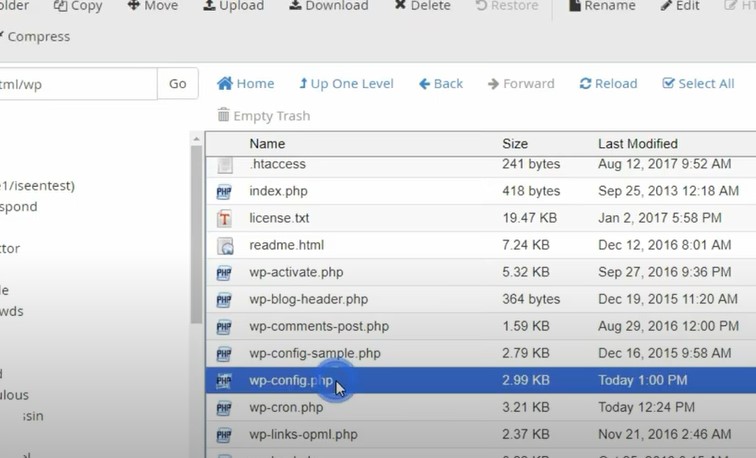
You can find it in the wp-config.php file . Change the value from ‘false’ to ‘true’. You can find it in the File Manager menu in cPanel.
Once in the cPanel tab , please select the File Manager menu .
You just need to look for the whereabouts of the wp-config.php file . Please check public_html , it’s possible the file is there.
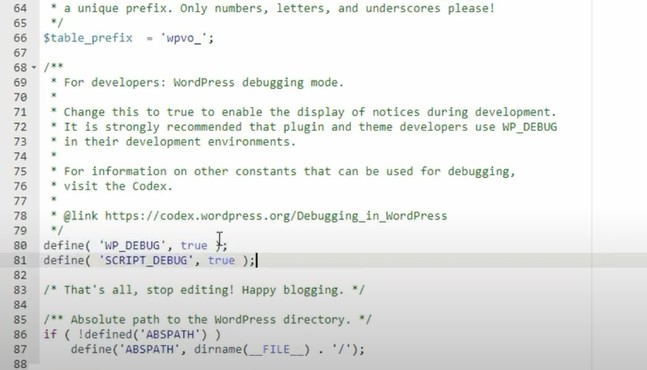
Open the file and look for define( ‘WP_DEBUG’, false ) . Please change the value ‘ false ‘ to ‘ true ‘ and save the file.
IMPORTANT!
After you find a bug and fix it, immediately change the value ‘true’ back to ‘false’.
This is because WordPress security is designed to “hide” website bugs or errors. If WP_DEBUG is active, then all error details can be read and become an opportunity for hackers to enter the WordPress system.
2. Enable WPDB Error Reporting
Do these tips if you identify an error in the website database.
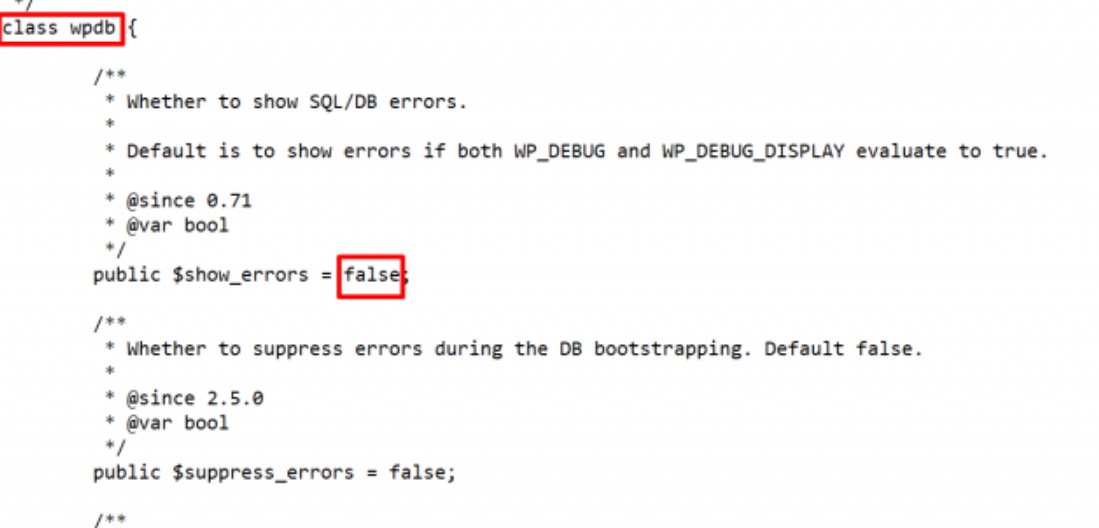
You can use this technique to display SQL errors in WordPress queries. The way to debug with these tips is to change the value of the $show_errors variable .
To enable WPDB Error Reporting, please go to the File Manager menu (like the tutorial on WP_DEBUG).
Then, open the file public_html/wp-includes/wp-db.php .
Look for the wpdb class and change the value $show_errors = false to true .
After that, WordPress will show all the queries made on your website and start performing error analysis.
IMPORTANT!
Do not debug on an active website, visitors will get an error message. We recommend using a dummy website or a website where you test all your code before releasing it.
3. Check Error Log
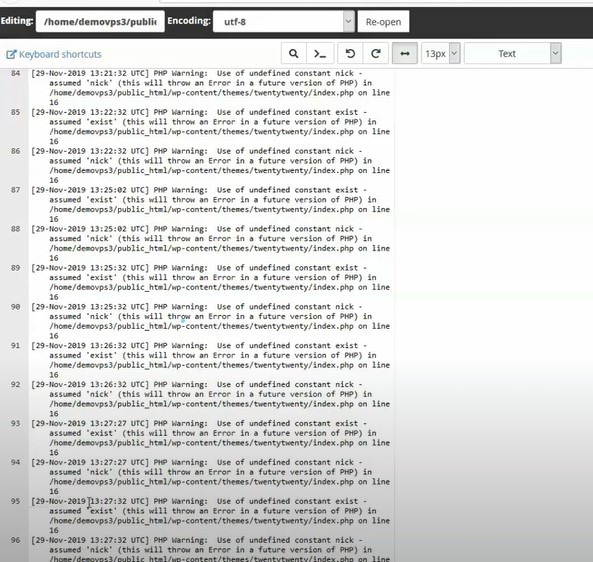
If you encounter an Internal Server Error while the website is being browsed, it’s likely an HTTP Error 500. All you have to do is debug, of course.
Although there is no detailed error information, you can check the website’s error log to deal with it.
When there is an error on the website, usually the hosting will automatically add the error_log file in the public_html folder . You can check for bugs or errors that occur there.
4. Use Website Staging

Direct bug fixes on the original live website are very risky, you know. All changes can be activated immediately and can make visitors feel uncomfortable.
In addition, if there is a fatal error, it could be that your original website is directly affected.
Well, to minimize unwanted things, you need to use a staging website when debugging.
Staging websites are clones of your original website. Point, to do all kinds of testing, including debugging. So you can preview the changes before they are released on the original website.
WordPress itself already has WordPress Staging, a feature you can use for testing.
You can get this feature and use it automatically in your Hosting Member Area. The activation method is very easy, just go to Hosting Member Area > WordPress Management > Sites > Staging .
5. Enable SCRIPT_DEBUG
Enabling SCRIPT_DEBUG can be done if there is an error in the script or plugin that you are running. For example, plugins not running, hidden, etc.
It could be because WordPress uses CSS and JavaScript files, but in a minified version. The goal is to speed up website loading.
To fix this, please go to File Manager and open the wp-config.php file.
Then, enter define( ‘SCRIPT_DEBUG’, true ) in the wp-config.php file.
After that, WordPress will automatically load the original CSS and JavaScript files. So that all plugins can run in full and you can continue to analyze errors.
6. Error Detection in PHP
For PHP programs, bugs often still occur. To find out any information about PHP status, compilation options, extensions, etc., you can monitor it in the phpinfo file.
The debugging method is to configure the php.ini file to enable error reporting.
However, to access this file you need root access, so you need a hosting package such as VPS in order to make configuration more flexible.
For those of you who don’t use a VPS, an alternative can be to use PHP Code Checker. Later these tools will check your entire code and help detect bugs.
There are also other tools that you can use, such as Eclipse and PHPStorm. After that, then you can enter the stage of proving bug error analysis.
7. Take advantage of Debugging Tools
We all know that the debugging process requires high accuracy and takes a lot of time. To ease your work, there’s nothing wrong with using the help of debugging tools.
Currently, there are many debugging tools available. Whether it’s for CMS WordPress, PHP coding, and other programming languages. Well, here are some examples of debugging tools that you can try:
- GDB Tools (GNU Project Debugger) : Debugging tools for C/C++ in Unix programming. This tool is also preinstalled on Linux systems.
- DDD Tools (Data Display Debugger) : Focus on running the Graphic User Interface on Unix systems.
- Eclipse : A tool that can help with the integration of editors, build tools, debuggers, and other development tools. Can be used on Windows, Linux, Solaris, etc systems.
- Query Monitor : A WordPress plugin that has the ability to enable database queries, PHP errors, stop editor blocks, etc.
- New Relic : A premium tool for WordPress that can monitor user experience, map WordPress architecture, to detect anomalies before they occur, and much more.
For reasons of effectiveness, what you can use when debugging are IDE or Integrated Development Environment tools .
Tools with this IDE system can combine the required performance tools. For example block editor, editing source code, debugger, etc.
Examples such as Eclipse. So you can monitor multiple jobs at once.
8. Check Syntax
Programmers are human too, agree? That’s why one of the bugs that often occurs is a syntax error.
Once the bug is identified, immediately check your syntax. It might just be missing a semicolon, it could be that the command line hasn’t been closed, or even just a one-letter typo in the command, etc.
Remember, the slightest mistake can cause errors and affect many aspects of your code.
9. Check Browser
Having problems with the display in the browser? It’s possible that it’s a bug caused by your code not being compatible with the browser.
For HTML and CSS code, problems related to the appearance of the website in the browser are often encountered. The way to fix this, try checking the display in several different browsers.
It’s a good idea to first check in several different browsers to make sure that your HTML and CSS code can appear flawlessly in the browser.
You can use test tools like BrowserShots, EndTest, Selenium, IE Tab, etc.
Ready to Battle Bugs?
By now, you already know what debugging is, why it is important to do it and how it works, up to 9 tips for debugging.
There are bugs in the code, like insects in the house. It’s annoying, but if not handled properly it can cause fatal damage.
Debugging is one solution and a way out to save your entire code.
Well, I hope this article helps you in debugging.


